The tool is currently limited to the analysis of asteroidal occultations. To
access the tool:
open an event in the Asteroid Observations Editor
When
the event is displayed, select the Menu option
Solutions... Open Fresnel Diffraction tool
The first time you use the tool, Occult will ask your permission to download
a 85MB executable file that was developed by Bob Anderson. Without that file,
the tool will not function. After you have done the download, you will get this
message:
The downloaded program is executed whenever
generates a Fresnel
diffraction map.
You will likely get a Windows message suggesting the
program
might be a risk, and asking you whether you really want to
run it
- with the default being no. Click Yes.
Another Windows form will appear.
On that form there is a
check box to control whether the Windows warning will
appear whenever you run the program. It is pre-checked.
Uncheck that box.
This will prevent the warning from
appearing whenever you run the program.
The issue behind this is the Windows systems for preventing Malware from being downloaded and run. This download file is perfectly safe. You need to indicate to Windows that you want the program to run, and that you do not want to be alerted each time it is run.
The general appearance of the form is:
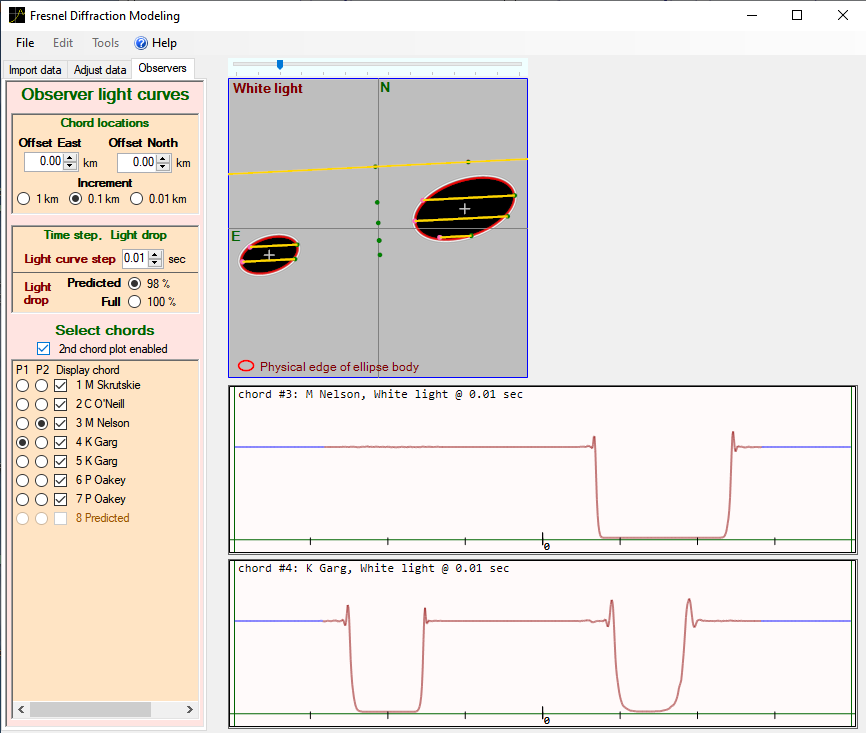
At the left there is a tabbed control panel.
The top right part of the form displays the sky plane configuration of the asteroid system with the Fresnel diffraction showing., and the observed chords. The size of that plot can be varied with the slider above that plot.
The bottom right of the form display either 1 or 2 light curves corresponding to the location of the chords as shown in the top image. The default display is of a single light curve at the bottom. A second light curve can be displayed by clicking the check box '2nd chord plot enabled' just above the list of observers
At the left of the form there are three tabbed control panels. Those panels are:
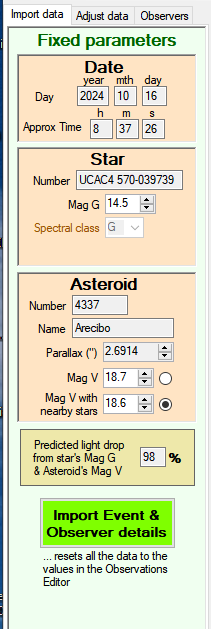
The Fixed parameters control is automatically filled with data from the Observations editor when it is opened. Much of the data that is transferred from the Observations editor is not displayed anywhere in the Fresnel tool. (For example, the observer site coordinates) because they should not be changed in the processing undertaken by this tool. The fields displayed on this tab are for information only, with most being used somewhere for labeling output. Most of the fields cannot be changed.
The only fields that can be changed are the Star and Asteroid magnitudes. These are used to generate the % light drop to be used in the generation of the light curves. The values in these fields should only be changed where there is a good reason to do so. One particular reason is the issue of a nearby star, and the issue of whether that nearby star has been included in the measurement aperture when the recording was measured. This may result in a need to change the asteroid magnitude between that for by itself, or with the nearby star being included.
The button Import Event & Observer details will re-populate almost all data elements in the Fresnel tool with the values from the Observations Editor. There are two reasons for doing this:
More importantly, from the tool you have derived improved values for the solution of the observation, and you have changed the details in the Observations Editor (& saved them so that they are not lost...). This button will populate the Fresnel tool with the edited values from the Observations Editor, so that you can confirm the editor has been correctly updated.
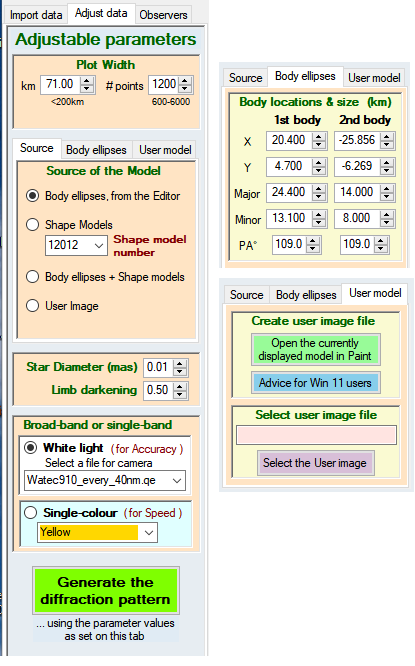
This tab sets out a list of data elements that can be changed by the user to improve the fit of the Fresnel light curve to the observed light curve.
The second group in this tab is itself a group of 3 tabs, setting out options for the source of the model, the size and relative locations of ellipse models, and the path to a User model. The details of this group are set out below
Width of the model.
in km This will be set when the tool
is opened, but may not be set wide enough to include all of both bodies of a
binary system. Adjust the size as needed.
Changing this setting after
the pattern has been generated will change the location of the chords against
the model outline. For Ellipse models, this achieves nothing. However for shape
models, the shape model diameter corresponding the displayed chord fit is
provided
in number of points. This sets the size of the data array that holds the diffraction pattern. The larger the array, the better the resolution but the slower the execution. Presently Occult uses a very basic method to read the array, and as a result there is little benefit to use a large array. The default size is 1200. If a shape model is displayed, the size is 800 [This is a fixed value associated with how the shape model display is created.]
Source/Body ellipses/UserModel - see below
Star diameter
The value is retrieved from the Observations Editor. However Gaia includes diameters assessed in potentially several different methods. The full range of values can be extracted from Gaia via the Observations Editor, menu item List... Star diameter - accurate Gaia measurement from Vizier, and values can be entered here. In some circumstances it may also be appropriate to vary the diameter to get a better fit to the observed light curve - thereby in effect measuring the star diameter. However to make such a conclusion, you need to be sure there are no other parameters that can be changed to fit the light curve; a measurement of the star diameter should only occur when that is the only possible way of fitting the observed light curve..
Limb darkening
The coefficient used to allow for limb darkening of a star. This only has any effect where the star's apparent diameter is significant. Probably many mas. The default value is set at 0.5, corresponding to a G type star. Indicative values for a range of star types are
| Type | Coeff |
| O | 0.05 |
| B | 0.2 |
| A | 0.5 |
| F | 0.6 |
| G | 0.7 |
| K | 0.7 |
| M | 0.6 |
Broad-band or single band
Because we observe with unfiltered cameras, the final light curve you will need is one generated using 'White light'. The calculation for white light covers a range of wavelengths, and includes the camera's quantum efficiency over those wavelengths.
When you download the file when you first use the tool, 5 files of camera detector types are included. They are:
qhy174QE_every_5nm.qe
qhy174QE_every_20nm.qe
Starlight_every_40nm.qe
Watec902_every_40nm.qe
Watec910_every_40nm.qe
These are displayed in the drop-down box, with the selection being maintained between sessions
The qhy entries are for the most common CMOS cameras currently in use. Starlight is for Starlight Express cameras, while the Watec entries are for the identified Watec video cameras. Generally speaking the files with the data at 40nm are more than accurate enough for our light curves. Small data spacings (eg 20nm or 5nm) involve computing the diffraction pattern for a large number of wavelengths - with minimal value for our light curves.
The files are held in the Occult subfolder \Fresnel\Program\. You can create your own file your your camera if you want. The format is available here, at the end.
The option to use a single color provides two possible uses:
Source/Body ellipses/User model tab groupings
Source
This sets the source of the model used to create the diffraction pattern. The options are:
Body ellipses... This uses the current ellipse fit from the observations editor to set the size, orientation and location of the object (including a satellite)
Shape models This is only enabled if a shape model is available for the asteroid. The drop-down box allows you to choose between the available models. The models are oriented exactly is in the Observations Editor. When a Shape Model is used, the Plot Width in pixels is automatically set at 800. This is because of how the shape model images are generated within Occult.
Body ellipses + Shape models. This allows you to overlap a shape model image with an ellipse image.
User model. This allows you to use a model that you can create. The primary approach to creating the User image is to start with either an Ellipse or Shape Model image, and edit that in an image editor.
Body ellipses
This sets out the location, size and orientation of the ellipse or ellipses used as the model. They are initially set from the Observations editor. The values are displayed at a 1 meter precision. Such a level of precision is generally not justifiable; however for small bodies that precision may become significant. Make adjustments here to get an improved fit of the light curves.
When a satellite is involved. the (x,y) values of the two bodies are set so that the opposite 'outer' edges of the bodies are equi-distant from the sides of the plot area.
When you get an improved light curve fit from adjusting these values, you should go back to the observations editor and make the corresponding changes. Then update the data in the Fresnel tool using the Import Event & Observer details button in the first Main tab - and check to make sure you have correctly updated the Observations Editor.
User model
Create user image file
This has two options:
Open the current... will open the currently displayed model image in 'Paint' ready for editing Unfortunately the availability of Paint in Win11 is not guaranteed, and it is not found by the processes available in precious versions of Windows.
Advice for Win 11 users will open a Help topic that will explain how to get the appropriate image file into an image editor of your choice.
When you have the image file in your image editor, edit it as you like. Do not change the overall dimensions of the image, as his will affect the image scaling. When you have made your edits, save to a file location of your choice. The Occult subfolder \Fresnel\InputImage files\ is provided for that purpose, but you can store it anywhere. Do not store it in the \Fresnel\Program\ subfolder.
When working on a solution using such an image, leave your image editor open. Having selected the User file (see next step), you can iteratively generate a diffraction pattern, make changes in the Image editor to try to create a better model, save it, and then generate the diffraction pattern again. This enables you to see the effect of changes to the model within a few seconds.
Select user image file
Use the Select the user image button to select the file you are editing, or have previously saved. The file name will be displayed on the upper box.
Generate the Diffraction Pattern
Any change to the data elements on this panel only come into effect when the Fresnel Diffraction pattern is computed.
Changes to some items will automatically generate a new diffraction pattern, but not all. In particular the elements in the Body Ellipses tab do not automatically generate a new diffraction pattern. So when data elements are changed, this button must be clicked to generate the diffraction pattern on the basis of the data elements on this panel. When you do this, any light curves displayed will be updtaed
Parameters you cannot adjust
There are two data elements that are deliberately excluded from any variation. They are:
 This panel lists all observers. It allows the positioning of all observers
(combined) relative to the model used to generate the Fresnel pattern. It also
displays the light curves from their locations
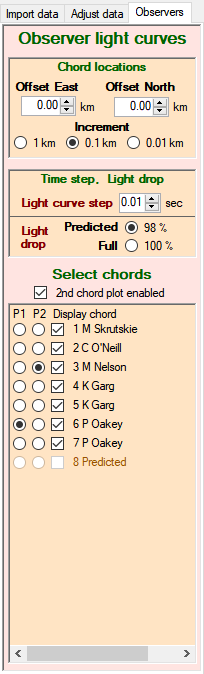
This panel lists all observers. It allows the positioning of all observers
(combined) relative to the model used to generate the Fresnel pattern. It also
displays the light curves from their locationsAdjust chord locations
This provides for the chords of all observers to be moved in an effort to find the best fit to the observed light curves. The positioning between the chords cannot be changed - their relative spacing is fixed by the location of their sites when they made they observation.
Time interval for light curve
Default setting is 0.01 secs. You can make the step larger, but there is little reason to do so.
Light drop
The default light drop is calculated from the star and asteroid magnitudes in the Date/objects tab. If there is a need to adjust the drop because of nearby stars, adjust the star magnitude on the Date/Objects tab. If desired, you can plot the light curve using a 100% light drop.
Select chords
This lists all observers for the event. For satellite events, observers who recorded both the main body and the satellite will have two entries - which provide identical results
To select a chord to display, check the radio button under the column P1. The form allows for two light curves to be displayed. To display a 2nd light curve, click the 2nd chord plot box above the list of observers. This will create a light curve display above the first light curve. The light curve displayed in this box is set under the column P2.
Light curve display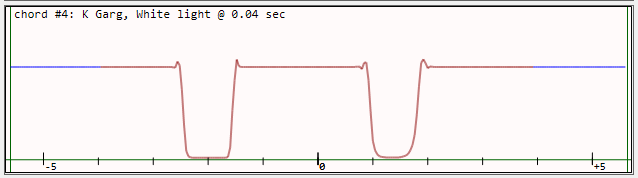
The length of the displayed light curve is set to correspond with the diagonal
distance of the displayed model. This is almost always longer than the length of
the chord across the displayed model. In the displayed light curves, the portion
of the light curve drawn in brown corresponds to the portion that has been
generated by the Fresnel model. The sections at each end drawn in blue are for
portions outside the boundaries of that model. They are drawn at a fixed level
corresponding to full light. Where a body in the model is close to, or crosses
over the boundaries of the model, the blue line does not represent the light
curve for that region of the body outside the boundary.
The text at the
top of the light curve provides the chord number, observer name, and the color
of the light used to generate the light curve.
The tick markers along the
horizontal axis are at 1.0 second intervals.
This is the final step for the analysis of the observed light curve. It provides for the currently computed Fresnel light curves to be plotted together with observed light curves. The interrelationship between the Light Curve Viewer and the Fresnel tool is intended to facilitate making adjustments. Once a light curve has been selected to view, you can make changes in the Fresnel tool, and display the resulting light curve in the viewer with a single click.
To display the Fresnel light curve in the viewer:
This will open this panel - which can be dragged to anywhere within the form
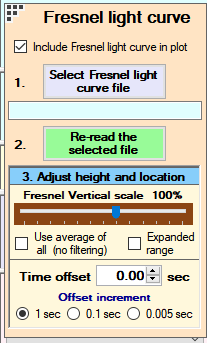
The controls within this panel are:
Select Fresnel light curve file. The Fresnel tool automatically creates files for the currently displayed light curves. The files have the following name structure:
This button is used to select the light curve to display. The selected file is displayed under this button.
Re-read the selected file This facilities updating the displayed light curve. When the data in the Fresnel tool is updated, the light curve file will also be updated. Simply click this button to display the updated light curve.
Adjust height and location.
Vertical scale The full-light level of the Fresnel light curve needs to be adjusted to match the full light level of the observed light curve. The tool will make an effort to estimate the full light level when a file is first opened. However this is not precise, and the level always needs some manual adjustment. For a 'clean' light curve having a large light drop and not a huge amount of noise, the routine will give a reasonably good approximation. However that approximation will be 'terrible' if the light drop is small and/or the noise level is very large. In these situations, check the Use average of all check box to get a better first approximation.
Time offset The Fresnel light curve will generally be displayed close to relevant position in the Observed light curve. The Time Offset control allows you to bring the light curves into alignment.
IMPORTANT. There is no capability to adjust the time scale of the Fresnel light curve. That light curve is displayed using a time scale that is identical to the observed light curve. Any disagreement in the alignment of the drops is associated with the details of the model used to generate the Fresnel curve - which then go back to changes that need to be made in the observations editor for the event solution.
This is an example of a fitted Fresnel light curve
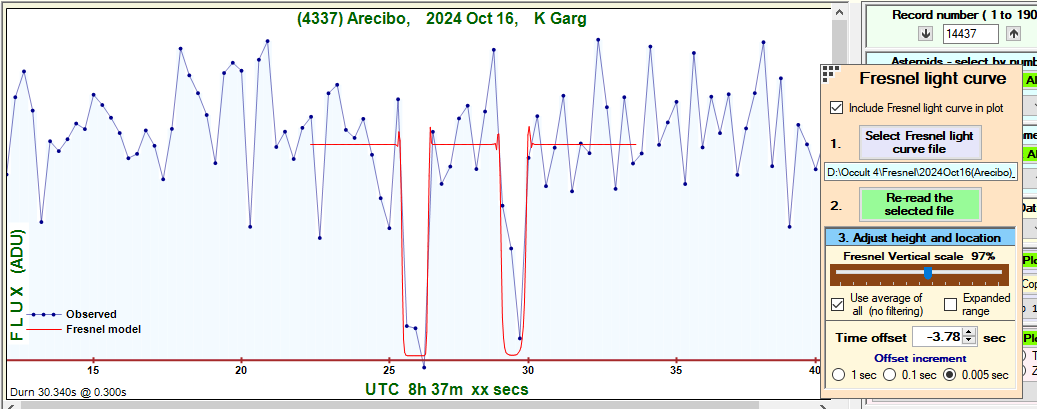
If you have a light curve displayed in the Light Curve Viewer with the Fresnel light curve also displayed, you can easily see the effect of changing either the Adjustable parameters, or the Observer offsets, as follows:
Data element changed in Adjustable parameters: Click Generate the Diffraction Pattern on the Fresnel tool. Then, on the Light Curve Viewer, simply click Re-read the selected file. The displayed Fresnel light curve will be immediately updated
Chord locations changes in Observers. simply click Re-read the selected file on the Light Curve Viewer.
There are two sets of files. Those used or generated by the program that generated the Fresnel diffraction pattern, and those generated by the Fresnel tool.
Files used/generated by the program that generates the pattern
These files are held on the Occult subdirectory .../Fresnel/Program,. They are:
The tool is a very powerful mechanism. Rather than relying on just two points of a light curve (that is, the point of D and R), the tool has regard to the entire light curve.
A particular example is the situation of a single chord against a potential asteroidal satellite. In modeling the Fresnel pattern to match the observed light curve, the following to parameters are particularly significant:
When assessing the range of the size of the body, both these parameters need to be assessed having regard to the noise in the light curve, and the observed time resolution.
The minimum diameter will be a central occultation of a circular body. Ensure the chord is located to cross the center of the body. Vary the diameter of the body such that the light drop matches the observed, and the width of the light curve at full light is as small as reasonably possible within the light curve time spacing and the noise. For small bodies, it is possible/likely that an Arago-Poisson spot. If the time resolution of the observed light curve is sufficiently small as to resolve any such spot, the location of the observed chord should be set such that there is matching to the presence/absence of that spot.
The maximum diameter will usually be based on an ellipse. Orient the ellipse such that the major axis is pointing towards the main body. Place the chord near the side of the body. The location relative to the edge will determine the depth of the light drop. Adjust the body dimensions to maximize its size and at the same time have a match at the full light level, and the light curve drop. In matching the full light level, match such that the Fresnel light curve width is as large as reasonably possible consistent with the time resolution and noise. In this process, the combination of the width and depth will (in practice) restrict the maximum size of the body.
The program used to create the Fresnel diffraction pattern (OccultDiffractionApp.exe) was written by Bob Anderson.Details about how this program is called are given here